The Phasor Diagram
In the last tutorial, we saw that sinusoidal waveforms of the
same frequency can have a Phase Difference
between themselves which represents the angular difference of the two
sinusoidal waveforms. Also the terms "lead" and "lag" as
well as "in-phase" and "out-of-phase" were used to indicate
the relationship of one waveform to the other with the generalized sinusoidal
expression given as: A(t) = Am sin(ωt ± Φ) representing the sinusoid in the
time-domain form. But when presented mathematically in this way it is sometimes
difficult to visualise this angular or phase difference between two or more
sinusoidal waveforms so sinusoids can also be represented graphically in the
spacial or phasor-domain form by aPhasor
Diagram, and this is achieved by using the rotating vector
method.
Basically a rotating vector, simply called a "Phasor" is a
scaled line whose length represents an AC quantity that has both magnitude
("peak amplitude") and direction ("phase") which is
"frozen" at some point in time. A phasor is a vector that has an
arrow head at one end which signifies partly the maximum value of the vector
quantity ( V or I ) and partly the end of the vector that rotates.
Generally, vectors are assumed to pivot at one end around a
fixed zero point known as the "point of origin" while the arrowed end
representing the quantity, freely rotates in an anti-clockwisedirection at an
angular velocity, ( ω )
of one full revolution for every cycle. This anti-clockwise rotation of the
vector is considered to be a positive rotation. Likewise, a clockwise rotation
is considered to be a negative rotation.
Although the both the terms vectors and phasors are used to
describe a rotating line that itself has both magnitude and direction, the main
difference between the two is that a vectors magnitude is the "peak
value" of the sinusoid while a phasors magnitude is the "rms
value" of the sinusoid. In both cases the phase angle and direction
remains the same.
The phase of an alternating quantity at any instant in time can
be represented by a phasor diagram, so phasor diagrams can be thought of as
"functions of time". A complete sine wave can be constructed by a
single vector rotating at an angular velocity ofω = 2πƒ, where ƒ is the frequency of the waveform. Then a Phasor is a quantity that has both
"Magnitude" and "Direction". Generally, when constructing a
phasor diagram, angular velocity of a sine wave is always assumed to be: ω in rad/s. Consider the phasor diagram
below.
Phasor Diagram of a Sinusoidal Waveform
As the single vector rotates in an anti-clockwise direction, its tip at point A will rotate one complete revolution of 360o or 2πrepresenting
one complete cycle. If the length of its moving tip is transferred at different
angular intervals in time to a graph as shown above, a sinusoidal waveform
would be drawn starting at the left with zero time. Each position along the
horizontal axis indicates the time that has elapsed since zero time, t = 0. When
the vector is horizontal the tip of the vector represents the angles at 0o, 180o and at 360o.
Likewise, when the tip of the vector is vertical it represents
the positive peak value, ( +Am )
at 90o or π/2 and the negative peak value, ( -Am ) at 270o or 3π/2. Then the time axis of the waveform represents the angle either
in degrees or radians through which the phasor has moved. So we can say that a
phasor represent a scaled voltage or current value of a rotating vector which
is "frozen" at some point in time, ( t )
and in our example above, this is at an angle of 30o.
Sometimes when we are analysing alternating waveforms we may
need to know the position of the phasor, representing the alternating quantity
at some particular instant in time especially when we want to compare two
different waveforms on the same axis. For example, voltage and current. We have
assumed in the waveform above that the waveform starts at time t = 0with a
corresponding phase angle in either degrees or radians. But if if a second
waveform starts to the left or to the right of this zero point or we want to
represent in phasor notation the relationship between the two waveforms then we
will need to take into account this phase difference, Φ of the waveform. Consider the diagram below
from the previous Phase Difference tutorial.
Phase Difference of a Sinusoidal Waveform
The generalised mathematical expression to define these two
sinusoidal quantities will be written as:
The current, i is
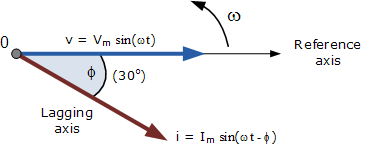
lagging the voltage, v by angle Φ and in our example above this is 30o. So the difference between the
two phasors representing the two sinusoidal quantities is angle Φ and the resulting phasor diagram will be.
Phasor Diagram of a Sinusoidal Waveform
The phasor diagram is drawn corresponding to time zero ( t = 0 ) on the horizontal axis.
The lengths of the phasors are proportional to the values of the voltage,
( V ) and the current, ( I ) at the instant in time that
the phasor diagram is drawn. The current phasor lags the voltage phasor by the
angle, Φ, as the
two phasors rotate in an anticlockwise direction as stated earlier, therefore
the angle, Φ is also
measured in the same anticlockwise direction.
If however, the waveforms are frozen at
time t = 30o, the corresponding phasor
diagram would look like the one shown on the right. Once again the current
phasor lags behind the voltage phasor as the two waveforms are of the same
frequency.
However, as the current waveform is now crossing the horizontal
zero axis line at this instant in time we can use the current phasor as our new
reference and correctly say that the voltage phasor is "leading" the
current phasor by angle, Φ. Either way, one phasor is designated as thereference phasor and all the other phasors will
be either leading or lagging with respect to this reference.
Phasor Addition
Sometimes it is necessary when studying sinusoids to add
together two alternating waveforms, for example in an AC series circuit, that
are not in-phase with each other. If they are in-phase that is, there is no
phase shift then they can be added together in the same way as DC values to
find the algebraic sum of the two vectors. For example, two voltages in phase
of say 50 volts and 25 volts respectively, will sum together as one 75 volts
voltage. If however, they are not in-phase that is, they do not have identical
directions or starting point then the phase angle between them needs to be
taken into account so they are added together using phasor diagrams to
determine their Resultant Phasor or Vector Sum by using the parallelogram
law.
Consider two AC voltages, V1 having a peak voltage of 20 volts, and V2 having a
peak voltage of 30 volts where V1 leads V2by 60o. The total voltage, VT of the
two voltages can be found by firstly drawing a phasor diagram representing the
two vectors and then constructing a parallelogram in which two of the sides are
the voltages, V1 and V2 as shown below.
Phasor Addition of two Phasors
By drawing out the two phasors to scale onto graph paper, their
phasor sum V1 + V2 can be
easily found by measuring the length of the diagonal line, known as the
"resultant r-vector", from the zero point to the intersection of the
construction lines 0-A. The downside of this graphical method is that it is time
consuming when drawing the phasors to scale. Also, while this graphical method
gives an answer which is accurate enough for most purposes, it may produce an
error if not drawn accurately or correctly to scale. Then one way to ensure
that the correct answer is always obtained is by an analytical method.
Mathematically we can add the two voltages together by firstly
finding their "vertical" and "horizontal" directions, and
from this we can then calculate both the "vertical" and
"horizontal" components for the resultant "r vector", VT. This analytical method which
uses the cosine and sine rule to find this resultant value is commonly called
the Rectangular Form.
In the rectangular form, the phasor is divided up into a real
part, x and an imaginary part, y forming the generalised expression
Z = x ± jy.
( we will discuss this in more detail in the next tutorial ). This
then gives us a mathematical expression that represents both the magnitude and
the phase of the sinusoidal voltage as:
So the addition of two vectors, A and B using
the previous generalised expression is as follows:
Phasor Addition using Rectangular Form
Voltage, V2 of 30 volts points in the reference
direction along the horizontal zero axis, then it has a horizontal component
but no vertical component as follows.
·
Horizontal component = 30 cos 0o = 30 volts
·
Vertical component = 30 sin 0o = 0 volts
·
This then gives us the rectangular expression for voltage V2 of: 30 + j0
Voltage, V1 of 20 volts leads voltage, V2 by 60o, then it has both horizontal
and vertical components as follows.
·
Horizontal component = 20 cos 60o = 20 x 0.5 = 10 volts
·
Vertical component = 20 sin 60o = 20 x 0.866 = 17.32 volts
·
This then gives us the rectangular expression for voltage V1 of: 10 + j17.32
The resultant voltage, VT is found by adding together the horizontal
and vertical components as follows.
·
VHorizontal = sum of real parts of V1 and V2 = 30 +
10 = 40 volts
·
VVertical = sum of imaginary parts of V1 and V2 = 0 +
17.32 = 17.32 volts
Now that both the real and imaginary values have been found the
magnitude of voltage, VT is determined by simply usingPythagoras's
Theorem for a 90o triangle
as follows.
Then the resulting phasor diagram will be:
Resultant Value of VT
Phasor Subtraction
Phasor subtraction is very similar to the above rectangular
method of addition, except this time the vector difference is the other
diagonal of the parallelogram between the two voltages of V1 and V2 as
shown.
Vector Subtraction of two Phasors
This time instead of "adding" together both the
horizontal and vertical components we take them away, subtraction.
The 3-Phase Phasor Diagram
Previously we have only looked at single-phase AC waveforms
where a single multi turn coil rotates within a magnetic field. But if three
identical coils each with the same number of coil turns are placed at an
electrical angle of 120o to each other on the same rotor shaft,
a three-phase voltage supply would be generated. A balanced three-phase voltage
supply consists of three individual sinusoidal voltages that are all equal in
magnitude and frequency but are out-of-phase with each other by exactly 120o electrical
degrees.
Standard practice is to colour code the three phases as Red, Yellow and Blue to identify each individual phase with the
red phase as the reference phase. The normal sequence of rotation for a three
phase supply is Red followed by Yellow followed by Blue,
( R, Y, B ).
As with the single-phase phasors above, the phasors representing
a three-phase system also rotate in an anti-clockwise direction around a
central point as indicated by the arrow marked ω in rad/s. The phasors for a three-phase balanced
star or delta connected system are shown below.
Three-phase Phasor Diagram
The phase voltages are all equal in magnitude but only differ in
their phase angle. The three windings of the coils are connected together at
points, a1, b1 and c1 to produce a common neutral connection
for the three individual phases. Then if the red phase is taken as the
reference phase each individual phase voltage can be defined with respect to
the common neutral as.
Three-phase Voltage Equations
If the red phase voltage, VRN is taken
as the reference voltage as stated earlier then the phase sequence will be R – Y – B so the voltage in the yellow phase lags VRN by 120o,
and the voltage in the blue phase lags VYN also by
120o. But we can also say the blue phase
voltage, VBN leads
the red phase voltage, VRN by 120o.
One final point about a three-phase system. As the three
individual sinusoidal voltages have a fixed relationship between each other of
120o they
are said to be "balanced" therefore, in a set of balanced three phase
voltages their phasor sum will always be zero as: Va + Vb + Vc = 0
credits & thanks electronics-tutorials.ws